Home GCX Home
Test images for aperture photometry evaluation
Radu Corlan December
28, 2004
Download
test-images.zip The test
images and data tables.
Test Images
In order to verify the precision of aperture photometry routines and
evaluate different algorithms, "life-like" star field images with precisely
known flux values are needed. Four synthetic images were created from sequence
files* of the AU CYG region.
The first two images:
aucyg-sparse-gaussian-2.5.fits
aucyg-sparse-moffat-2.5.fits
contain only stars that are brighter than the 15-th magnitude. Stars
that were close together have been deleted. These images can be used to
gauge the precision of the reduction routines in sparse field conditions
(so they check for algorithm errors). The star positions and magnitudes are
listed in "sparse-stars.tbl" (which is converted from the gcx star file sparse-stars.rcp).
The other two files:
aucyg-gaussian-2.5.fits
aucyg-moffat-2.5.fits
contain all the stars in the sequence file (down to mag 19 or so). The
complete listing is in "aucyg-allstars.tbl" (which is converted from aucyg-allstars.rcp).
They are useful to test the influence of contaminating objects.
The files contain synthetic stars images of either Gaussian or Moffat
profiles, both with a FWHM of 2.5 pixels. The Moffat profiles have a "beta"
parameter of 4. The plate scale is 1.5 arcseconds/pixel. The FITS header
contains wcstools-like WCS information.
The flux of the generated stars is precisely that listed in the table
(so a magnitude of e.g. 14.929 should read "14.929000"). Some small errors
are introduced by 16-bit quantisation. For stars brighter than mag 13, these
errors are below 0.0001 mags. For stars between 14.5 and 15, they can be
up to 0.0005. The positions of the stars' centroids are accurate to better
than 0.1 pixels.
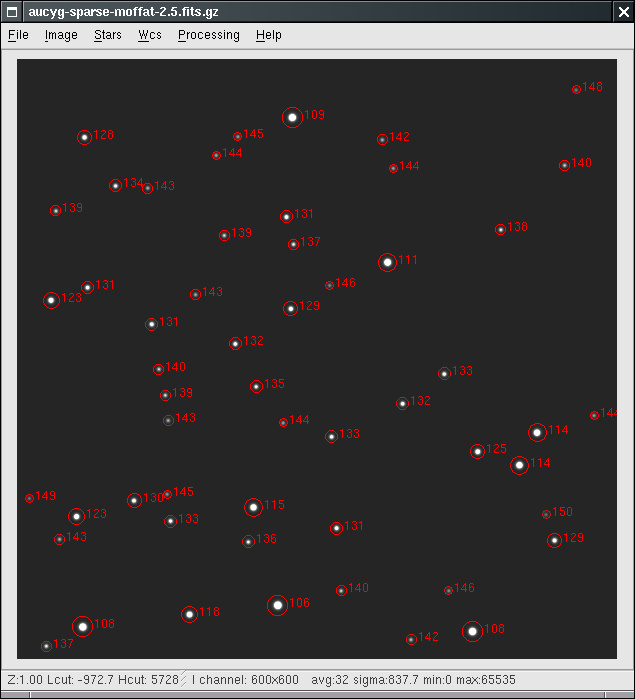
Screenshots
The screenshots below show the "sparse" and "full" images with star symbold
overlaid.


GCX Results
The magnitudes of the stars listed in "sparse-stars.tbl" were extracted
from the test images using gcx. Two central aperture shapes were used: the
"whole pixels" shape, which sums the flux from whole pixels that are within
the the specified aperture radius; and "irregular polygon", method that includes
a fraction of the intensity of pixels that are located on the central aperture
boundary. The name comes from the fact that the calculation methos used
approximated the circular aperture shape with an irregular polygon. This
method is also used in the IRAF phot routine.
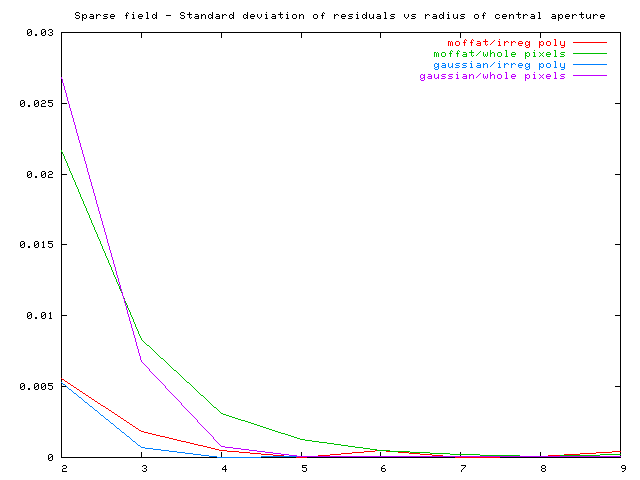
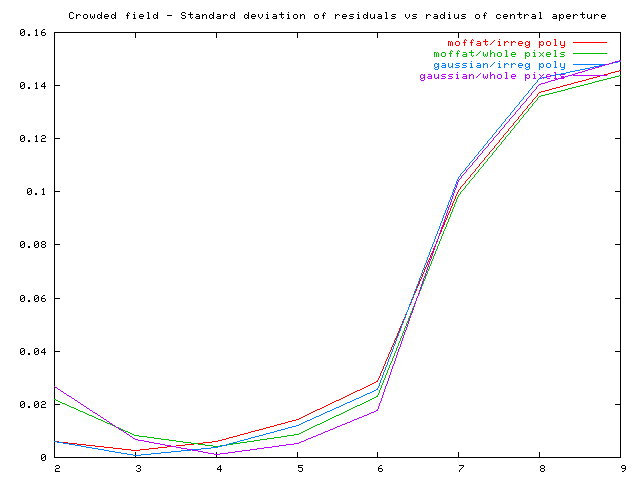
For each aperture shapes, radiuses of 2, 3, 4, 5, 6, 7, 8 and 9 pixels
were used. The standard deviation of residuals of the fit of extracted magnitudes
to the "true" ones was calculated. The full results of the test are listed
in "test.out". The "runtests" script was used to generate this file. The
results are plotted below.
* AU CYG area sequence by Arne Henden